A buyer called me in June with a number already in hand. The citywide Manhattan Beach median, she'd read, hit $3.35 million as of the first quarter of 2026, up from $3.025 million at the end of 2024. She wanted to know what that number would actually buy her. My honest answer: nothing in particular. That figure is an average of four housing markets that behave almost nothing alike, and depending on which one she shopped, $3.35 million would either land her a comfortable rebuild in the Tree Section a few blocks from Mira Costa High School or get her outbid on a Sand Section lot before she ever saw a floor plan.
That's the mistake I see most often with buyers who arrive in Manhattan Beach after cross-shopping the South Bay on portals. They treat the city's median like a single market with a single price curve. It isn't. Manhattan Beach's own MLS divides the city into four distinct real estate areas, and each one prices a different thing.
Four Sections, Four Different Games
Here's the basic geography, because it matters more than most buyers expect:
- Sand Section runs along the city's two-mile coastline, including Downtown and the North End near El Porto. Lots are narrow, homes are vertical, and this is where you'll find the walk streets, the car-free pedestrian corridors between the beach blocks.
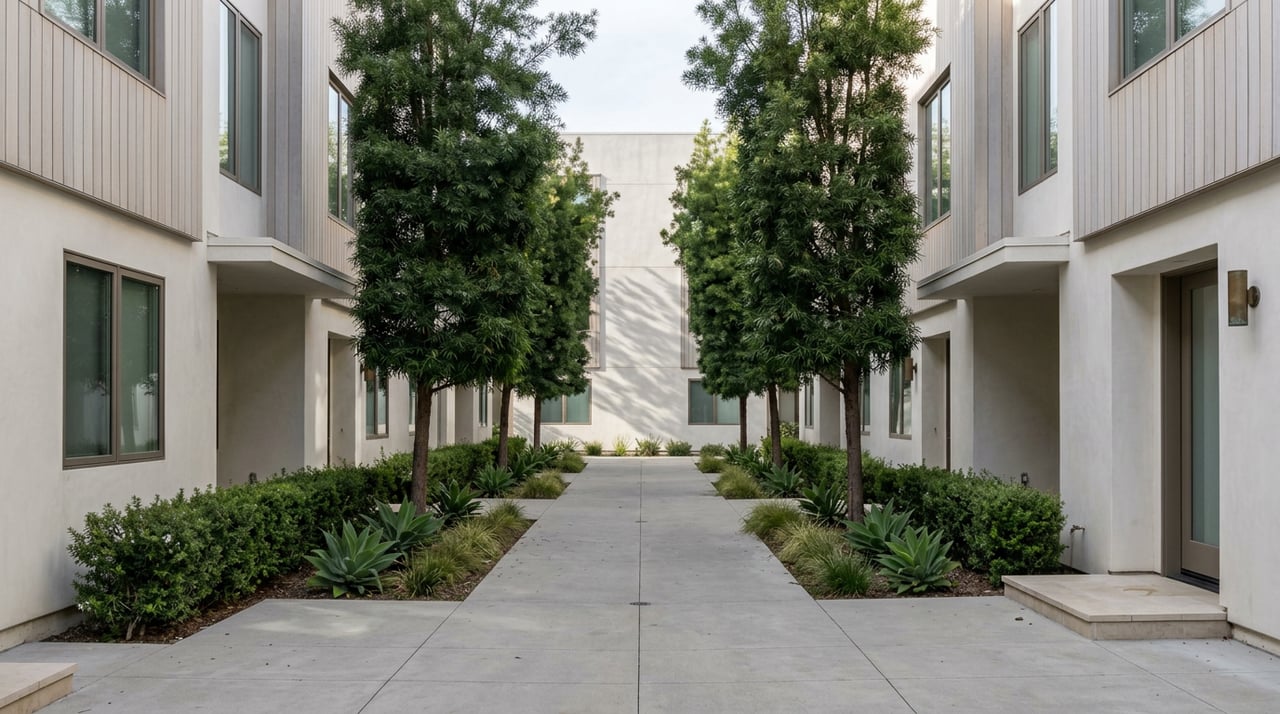
- Tree Section sits on streets named for trees, Elm, Oak, Poinsettia, and forms the city's largest suburban footprint, centered on Mira Costa High School and the walkable village.
- Hill Section occupies the bluff east of Highland Avenue and west of Sepulveda Boulevard, with the city's largest residential lots and, on many parcels, unobstructed ocean views stretching toward Palos Verdes.
- East Manhattan Beach, everything east of Sepulveda Boulevard, is the most suburban and most accessible entry point into Manhattan Beach Unified, with Polliwog Park anchoring the neighborhood feel.
Buyers usually start with a citywide thesis: they want to be in Manhattan Beach. The real decision happens one layer down, and the four sections don't just differ in lot size and walkability. They differ in what a dollar is actually paying for.
The Number That Flips: Price Per Square Foot Versus Total Price
This is the part that catches people off guard. Sand Section consistently posts the highest price per square foot in the city, with figures across recent 2026 reports ranging from about $1,565 up to roughly $2,320 depending on the month and whose data you're reading. Tree Section runs lower, generally $1,480 to $1,920 per square foot. Hill Section lands in between on a per-square-foot basis, commonly cited around $1,644.
But total sale price tells a different story. Hill Section regularly posts the highest median total price in the city, with estimates ranging from roughly $6.5 million to more than $8 million depending on the data source and the month sampled. That gap between sources is real, not a typo. It exists because Hill Section trades so few homes in a given quarter that one or two ultra-high-end closings can shift the median dramatically.
The reason for the inversion is straightforward once you see it. Sand Section lots are small and scarce, so the price gets compressed into every square foot of a tight envelope. Hill Section lots are large, often 4,500 to 9,000 square feet, with sloped parcels and view corridors that can't be replicated. Buyers there aren't optimizing for efficient square footage. They're paying for the parcel and the view, and the house sitting on it is almost secondary.
In late July 2026, a Hill Section lot with prime ocean-view exposure was on track to set a new land-value record for the section, just months after the previous record had already been set. Nobody was bidding on the floor plan. They were bidding on the dirt, because in the Hill Section the buildable envelope and the view corridor are the product. The structure that eventually goes up is close to beside the point.
Walk Streets: Paying for Dirt, Literally
Sand Section has its own version of this same mechanism, and it shows up most nakedly on the walk streets. In June 2026, a small original cottage on 9th Street came to market priced at roughly $4.9 million, explicitly marketed for its land value rather than the existing structure. That pricing made more sense once you learned that a comparable walk-street lot on the same block had sold in early 2025 for $5.5 million with multiple offers, and it never even reached the open market.
That's the clearest illustration in this entire city of what buyers are actually purchasing. A walk street lot isn't scarce because of the house on it. It's scarce because Manhattan Beach isn't making any more car-free, community-facing frontage between Highland Avenue and the sand. The house is a renovation project or a teardown. The location is the asset.
Why the Citywide Median Swings So Hard
If you've noticed that different sources quote wildly different numbers for Manhattan Beach, days on market, sale-to-list ratio, even the median itself, that's not sloppy reporting. It's a symptom of the same underlying problem: this is a thin market getting treated like a deep one.
Citywide active inventory tells the story on its own. As of February 15, 2026, there were 49 active listings citywide. By May 15, that had climbed to 72. By June 30, inventory peaked at 80 listings. Two weeks later, by July 15, it had already pulled back to 69. That's not a market with a stable baseline. That's a market where supply arrives in bursts, section by section, and where a single week's new listings can meaningfully shift what's available in any given price tier.
Closed sales tell a similar story. The number of closed transactions in Manhattan Beach fell from 34 in February 2025 to 25 in February 2026, a 26 percent volume decline year over year. With a sample that small, a couple of premium Hill Section or Strand closings can swing the citywide median in either direction without reflecting any change in what a typical home is worth. Days-on-market figures show the same instability. One recent snapshot put the citywide average around 28 days over a three-month window ending in May 2026, while a separate February 2026 measure put it near 78 days. That range isn't a contradiction to resolve. It's evidence that the aggregate number is blending markets that don't belong together, a well-priced Tree Section rebuild that sells in three weeks and a Hill Section trophy listing that sits for months waiting for the right buyer.
What This Actually Means If You're Comparing Sections
The useful question was never "what's the Manhattan Beach median." It's "which section, and what is that section actually pricing." If you want walkability and are comfortable paying a premium for land scarcity, Sand Section is honest about what it costs and why. If you want the most livable square footage per dollar and a settled, family-oriented block, Tree Section is usually the more efficient trade. If you want lot size and a view that can't be replicated, Hill Section will ask you to underwrite a longer timeline and a thinner buyer pool if you ever need to sell above $8 million. If MBUSD access matters more than the address itself, East Manhattan Beach remains the most attainable door into the same school district.
None of that shows up in a single median number, and none of it should. The city's four sections aren't variations on one market. They're four different products wearing the same zip code.
FAQ
Does a lower price per square foot mean a better deal in Manhattan Beach? Not necessarily. Hill Section often has a lower price per square foot than Sand Section, yet posts the highest total sale prices in the city because of lot size and view premiums. A lower per-square-foot number can simply mean you're paying for land rather than living space.
Why are some walk-street listings priced "for land value" instead of the home's condition? Because the scarcity is in the frontage, not the structure. Manhattan Beach isn't creating new walk-street lots, so buyers and sellers both know the eventual outcome is often a renovation or rebuild, and pricing reflects that from the start.
Is Manhattan Beach currently a buyer's market or a seller's market? It depends entirely on the section and price tier. Homes in the $2.5 million to $4.5 million range have generally moved quickly through 2025 and 2026, often in three to six weeks. Above $8 million, the buyer pool is thinner and timelines can stretch to several months. Treating the city as one uniform market in either direction will lead you to the wrong strategy.
If you're trying to figure out which Manhattan Beach section actually fits your budget and your life, that's a conversation worth having before you start touring, not after. I've spent more than 40 years working this stretch of the South Bay, and I'd rather walk you through the real math on Sand versus Hill versus Tree than let a citywide median make the decision for you. Bill Ruane is a phone call away. Let's Connect.